Perception-Aware Texture Similarity Prediction


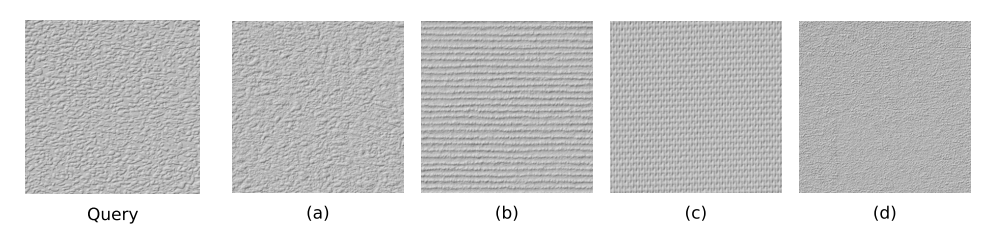
A query texture and four retrieval textures contained in the Pertex [2] data set. The SSIM value computed between each retrieval texture and the query texture is 0.0264. However, the corresponding similarity values contained in the Isomap perceptual similarity matrix [18] manifest great variations, which are 0.85286, 0.37449, 0.36677 and 0.544 in turn.

Abstract
Texture similarity plays important roles in texture analysis and material recognition. However, perceptuallyconsistent fine-grained texture similarity prediction is still challenging. The discrepancy between the texture similarity data obtained using algorithms and human visual perception has been demonstrated. This dilemma is normally attributed to the texture representation and similarity metric utilised by the algorithms, which are inconsistent with human perception. To address this challenge, we introduce a Perception-Aware Texture Similarity Prediction Network (PATSP-Net). This network comprises a Bilinear Lateral Attention Transformer network (BiLAViT) and a novel loss function, namely, RSLoss. The BiLAViT contains a Siamese Feature Extraction Subnetwork (SFEN) and a Metric Learning Subnetwork (MLN), designed on top of the mechanisms of human perception. On the other hand, the RSLoss measures both the ranking and the scaling differences. To our knowledge, either the BiLAViT or the RSLoss has not been explored for texture similarity tasks. The PATSP-Net performs better than, or at least comparably to, its counterparts on three data sets for different fine-grained texture similarity prediction tasks. We believe that this promising result should be due to the joint utilization of the BiLAViT and RSLoss, which is able to learn the perception-aware texture representation and similarity metric.
Network Architecture

test

Experimental Results

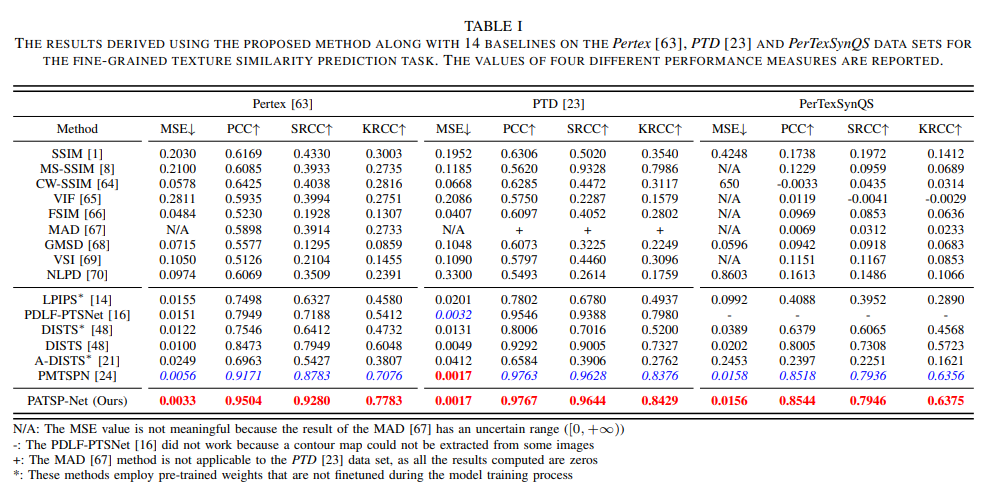
The results derived using the proposed method along with 14 baselines on the Pertex, PTD and PerTexSynQS data sets for the fine-grained texture similarity prediction task. The values of four different performance measures are reported.

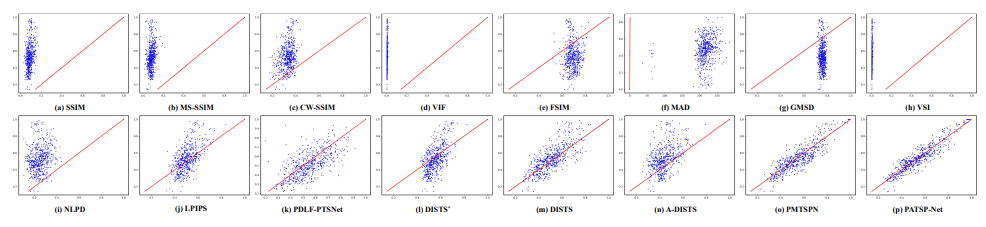
The scatter plots drawn using the similarity data predicted using 14 baselines and the proposed method against the human perceptual similarity data, when the Pertex [63] data set is used.